Optimize your DevOps with Prometheus and Grafana: Unleash the power of effective monitoring strategies.
Effective monitoring is crucial in a DevOps environment to ensure the smooth operation of systems and applications. Prometheus and Grafana are two popular tools that can be used together to implement robust monitoring strategies. Prometheus is an open-source monitoring system that collects and stores time-series data, while Grafana is a data visualization and analytics platform. This combination allows DevOps teams to monitor various metrics, set up alerts, and gain valuable insights into the performance and health of their systems. In this article, we will explore the benefits of using Prometheus and Grafana for monitoring in DevOps and discuss some effective strategies for implementing them.
Implementing Prometheus and Grafana for Real-time Monitoring in DevOps
Implementing Prometheus and Grafana for Real-time Monitoring in DevOps
In the fast-paced world of DevOps, real-time monitoring is crucial for ensuring the smooth functioning of applications and infrastructure. Prometheus and Grafana are two powerful tools that can be used together to provide effective monitoring solutions. In this article, we will explore how to implement Prometheus and Grafana for real-time monitoring in DevOps.
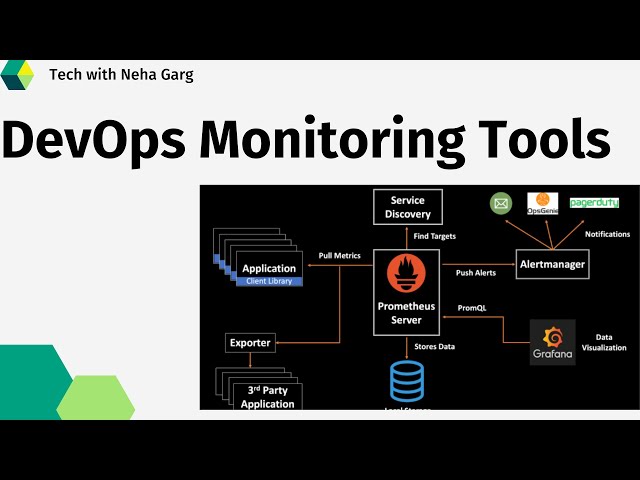
Prometheus is an open-source monitoring system that collects metrics from various sources, stores them, and provides a flexible query language to analyze and visualize the data. Grafana, on the other hand, is a popular open-source platform for creating beautiful and interactive dashboards. Together, they form a powerful combination for monitoring and visualizing metrics in real-time.
To get started with Prometheus and Grafana, the first step is to set up Prometheus as the data source for Grafana. This can be done by configuring Prometheus to expose its metrics endpoint and then adding it as a data source in Grafana. Once the data source is set up, Grafana can start querying Prometheus for metrics and displaying them on dashboards.
One of the key features of Prometheus is its ability to scrape metrics from various targets. These targets can be anything from applications, servers, or even other monitoring systems. Prometheus uses a pull-based model, where it periodically scrapes metrics from the configured targets. This allows for real-time monitoring of the system and provides valuable insights into its performance.
In addition to scraping metrics, Prometheus also supports the concept of exporters. Exporters are small programs that expose metrics in a format that Prometheus can understand. There are a wide variety of exporters available for different technologies, such as databases, web servers, and cloud platforms. By using exporters, Prometheus can collect metrics from a wide range of sources and provide a comprehensive view of the system.
Once Prometheus is set up and collecting metrics, Grafana can be used to create dashboards for visualizing the data. Grafana provides a rich set of visualization options, including graphs, tables, and heatmaps. It also supports the concept of panels, which are individual components that can be added to a dashboard. Panels can display different types of metrics and can be customized to suit specific monitoring needs.
To create a dashboard in Grafana, one can start by selecting the desired data source (Prometheus in this case) and then adding panels to the dashboard. Each panel can be configured to display specific metrics and can be customized with various options, such as time range, aggregation functions, and thresholds. Grafana also supports the concept of variables, which can be used to create dynamic dashboards that can be filtered based on specific criteria.
Another useful feature of Grafana is its alerting capabilities. Grafana can be configured to send alerts based on predefined conditions. These conditions can be based on thresholds, trends, or even complex queries. When an alert is triggered, Grafana can send notifications via various channels, such as email, Slack, or PagerDuty. This allows for proactive monitoring and quick response to any issues that may arise.
In conclusion, implementing Prometheus and Grafana for real-time monitoring in DevOps can greatly enhance the visibility and performance of applications and infrastructure. By leveraging the power of Prometheus to collect and store metrics, and Grafana to visualize and analyze the data, DevOps teams can gain valuable insights into the system’s behavior and take proactive measures to ensure its smooth functioning. With their flexibility and ease of use, Prometheus and Grafana are indeed effective monitoring strategies for DevOps.
Best Practices for Setting Up Alerts and Notifications with Prometheus and Grafana
Effective Monitoring Strategies with Prometheus and Grafana in DevOps
In the world of DevOps, monitoring plays a crucial role in ensuring the smooth operation of applications and infrastructure. Prometheus and Grafana are two popular tools that provide powerful monitoring capabilities. However, setting up effective alerts and notifications is essential to ensure timely response to critical issues. In this article, we will discuss some best practices for setting up alerts and notifications with Prometheus and Grafana.
First and foremost, it is important to define clear objectives for monitoring. This involves identifying the key metrics and thresholds that need to be monitored. By understanding the critical aspects of your application or infrastructure, you can set up alerts that are relevant and actionable. It is also important to involve all stakeholders in this process to ensure that everyone is on the same page.
Once the objectives are defined, it is time to configure Prometheus to collect the necessary metrics. Prometheus provides a flexible query language that allows you to define custom metrics and alerts. It is important to choose the right metrics that provide meaningful insights into the health and performance of your system. Additionally, it is recommended to use labels to add context to your metrics, making it easier to filter and group them in Grafana.
Grafana, on the other hand, is a powerful visualization tool that allows you to create dashboards and alerts based on the metrics collected by Prometheus. When setting up alerts in Grafana, it is important to consider the severity and urgency of each alert. You should also define clear notification channels, such as email, Slack, or PagerDuty, to ensure that the right people are notified promptly.
To avoid alert fatigue, it is important to set up alerting rules that are both accurate and reliable. This involves defining appropriate thresholds for each metric and ensuring that the alerts are triggered only when necessary. It is also recommended to use techniques like hysteresis to prevent flapping alerts, where an alert rapidly switches between firing and resolving states.
Another best practice is to regularly review and fine-tune your alerts and notifications. As your application or infrastructure evolves, the metrics that were once critical may become less important, or new metrics may become relevant. By periodically reviewing and updating your alerts, you can ensure that they remain effective and aligned with your monitoring objectives.
In addition to proactive monitoring, it is also important to have a robust incident response process in place. This involves defining clear escalation paths and responsibilities for different types of alerts. It is also recommended to conduct regular incident response drills to ensure that everyone is familiar with the process and can respond effectively in case of an actual incident.
Finally, it is important to continuously monitor the performance and reliability of your monitoring system itself. Prometheus and Grafana provide built-in metrics that can be used to monitor their own health. By setting up alerts for these metrics, you can ensure that any issues with your monitoring system are detected and resolved promptly.
In conclusion, setting up effective alerts and notifications with Prometheus and Grafana is crucial for successful monitoring in DevOps. By defining clear objectives, configuring the right metrics, and fine-tuning your alerts, you can ensure timely response to critical issues. Regularly reviewing and updating your alerts, having a robust incident response process, and monitoring the health of your monitoring system are also important best practices to follow. With these strategies in place, you can achieve effective monitoring and ensure the smooth operation of your applications and infrastructure.
Optimizing Performance Monitoring with Prometheus and Grafana in DevOps
Effective Monitoring Strategies with Prometheus and Grafana in DevOps
In the world of DevOps, monitoring plays a crucial role in ensuring the smooth functioning of applications and infrastructure. It allows teams to identify and resolve issues before they impact end-users. Prometheus and Grafana are two powerful tools that, when used together, can provide an effective monitoring solution for DevOps teams.
Prometheus is an open-source monitoring system that collects metrics from various sources, such as applications, servers, and databases. It stores these metrics in a time-series database, allowing for easy querying and analysis. Grafana, on the other hand, is a data visualization tool that provides a user-friendly interface for creating dashboards and visualizing metrics.
One of the key benefits of using Prometheus and Grafana is their ability to provide real-time monitoring. With Prometheus, you can set up alerts based on predefined thresholds, allowing you to proactively address issues before they become critical. Grafana complements this by providing visually appealing dashboards that give you a holistic view of your system’s performance.
To optimize performance monitoring with Prometheus and Grafana, it is essential to define the right set of metrics to monitor. This requires a deep understanding of your application and infrastructure. Start by identifying the key performance indicators (KPIs) that are critical to your system’s health. These could include metrics such as CPU usage, memory utilization, network latency, and response times.
Once you have identified the metrics to monitor, you can use Prometheus to collect and store them. Prometheus supports various data collection methods, including exporters, which are specialized agents that collect metrics from specific sources. These exporters can be configured to scrape metrics from applications, servers, or databases at regular intervals.
To visualize the collected metrics, you can leverage Grafana’s powerful dashboarding capabilities. Grafana allows you to create visually appealing dashboards that provide real-time insights into your system’s performance. You can customize these dashboards to display the metrics that are most relevant to your team. For example, you can create separate dashboards for different components of your system, such as frontend, backend, and database.
In addition to real-time monitoring, Prometheus and Grafana also offer historical analysis capabilities. Prometheus stores metrics in a time-series database, allowing you to query and analyze historical data. This can be useful for identifying trends and patterns in your system’s performance over time. Grafana provides a user-friendly interface for querying and visualizing this historical data, making it easy to gain insights into your system’s behavior.
To ensure the effectiveness of your monitoring strategy, it is important to regularly review and refine your metrics. As your system evolves, the metrics that were once critical may become less relevant, and new metrics may become important. By continuously evaluating and updating your metrics, you can ensure that your monitoring strategy remains aligned with your system’s needs.
In conclusion, effective monitoring is essential for the success of any DevOps team. Prometheus and Grafana provide a powerful combination of tools for optimizing performance monitoring. By defining the right set of metrics, collecting and storing them with Prometheus, and visualizing them with Grafana, you can gain real-time insights into your system’s performance and proactively address issues. Additionally, the historical analysis capabilities of Prometheus and Grafana allow you to identify trends and patterns in your system’s behavior. By regularly reviewing and refining your metrics, you can ensure that your monitoring strategy remains effective as your system evolves.In conclusion, Prometheus and Grafana are effective monitoring strategies in DevOps. They provide comprehensive monitoring capabilities, allowing teams to collect and analyze metrics from various sources in real-time. Prometheus offers a powerful data model and flexible querying language, enabling efficient data collection and analysis. Grafana complements Prometheus by providing a user-friendly interface for visualizing and exploring the collected metrics. Together, these tools enable DevOps teams to gain valuable insights into their systems’ performance, troubleshoot issues, and make data-driven decisions to improve overall efficiency and reliability.